Cohorting and optimal pathway management of COVID-19 patients in Croydon
My name is Dr Rosh Siva. I am head of Respiratory medicine at Croydon University Hospital. I was given the task of arranging cohorting of COVID patients. We came up with a system which is easy to set up and provides operational teams with simple methodology to achieve optimal cohorting.
This is based on a colour coded board, locally known as the “Rosh board” (diagram 1) which can be used in a manual format or digitally (diagram 2).
In addition to the board we are using analytical software provided by a company called PATIENTEER. Working closely with Craig Burke, the CEO of PATEINTEER, we customised current software to help optimally manage COVID patients throughout their in-patient journey. The software provides an overview of current trust COVID status. It flags up clinical parameters and changes in observations such as Oxygen saturation and NEWS-2 scores. It highlights sub-optimal performance clinically and at a systems level.
Our main aims are to:
• To reduce patient mortality by optimising cohorting and clinical management of COVID patients.
• Enable site team to make rapid and optimal bed allocation of suspected and COVID confirmed patients.
• Maintain “eye in the sky” capability to inform teams of patients with worsening clinical parameters.
• Compile analysis of systemwide data to rapidly optimise patient pathways.
CRT (Croydon Respiratory Team) collate microbiology results and populate the current Excel database. Data is entered manually but we plan to make this automated soon. This database shows the exact location of every suspected and confirmed COVID patient.
The database can be accessed by all clinical, operational, and management teams and currently is presented at a COVID clinical meeting at 12.30 daily.
CRT and COVID ward doctors have carried out “eye in the sky” virtual reviews of real-time patient observation data (diagram 3) and have intervened on several occasions. These interventions have included recommendations regarding increasing the frequency of patient observations by nursing staff and also direct referral to CCOT (critical care outreach team). This function is proving vital as nursing skill-mix and nursing numbers become sub-optimal due to workforce challenges.
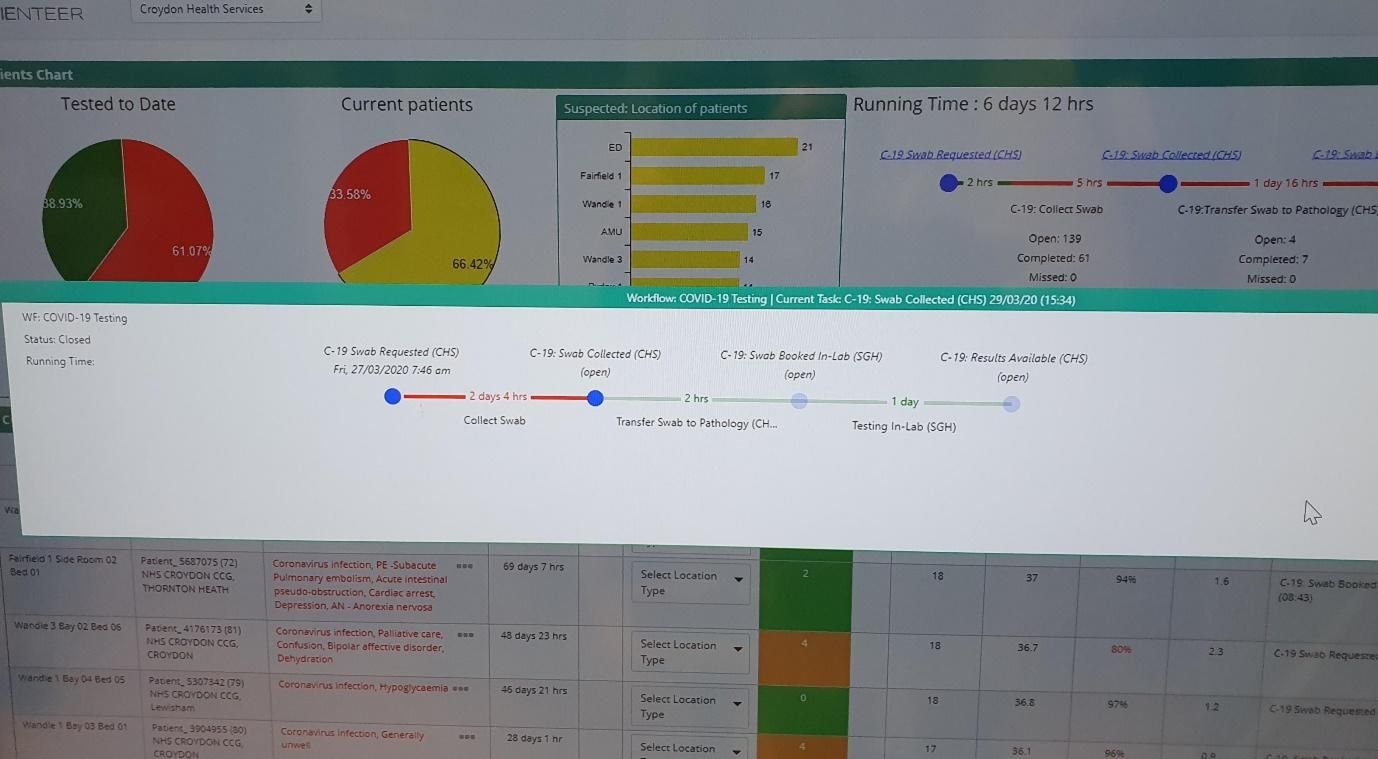
Another key area where PATIENTEER is having an impact is in tracking the location of an individual patient’s throat swab (diagram 4) but it also able to analyse the whole systemwide pathway of swabs from ordering on computer, to collection locally, to transit to reference laboratory, to final result. The system is able to report median times for each section of this pathway therefore highlighting bottlenecks at a systems level which then can be targeted for optimisation.
Data regarding mortality of COVID confirmed patients is being collected. By the end of day 1 of our system 54.7% (29 out of 53) of patients were optimally located in our COVID wards. Exactly 1 week later 79.8% (186 out of 233) of patients were optimally located (diagram 2).
Diagram 1: The “Rosh board”
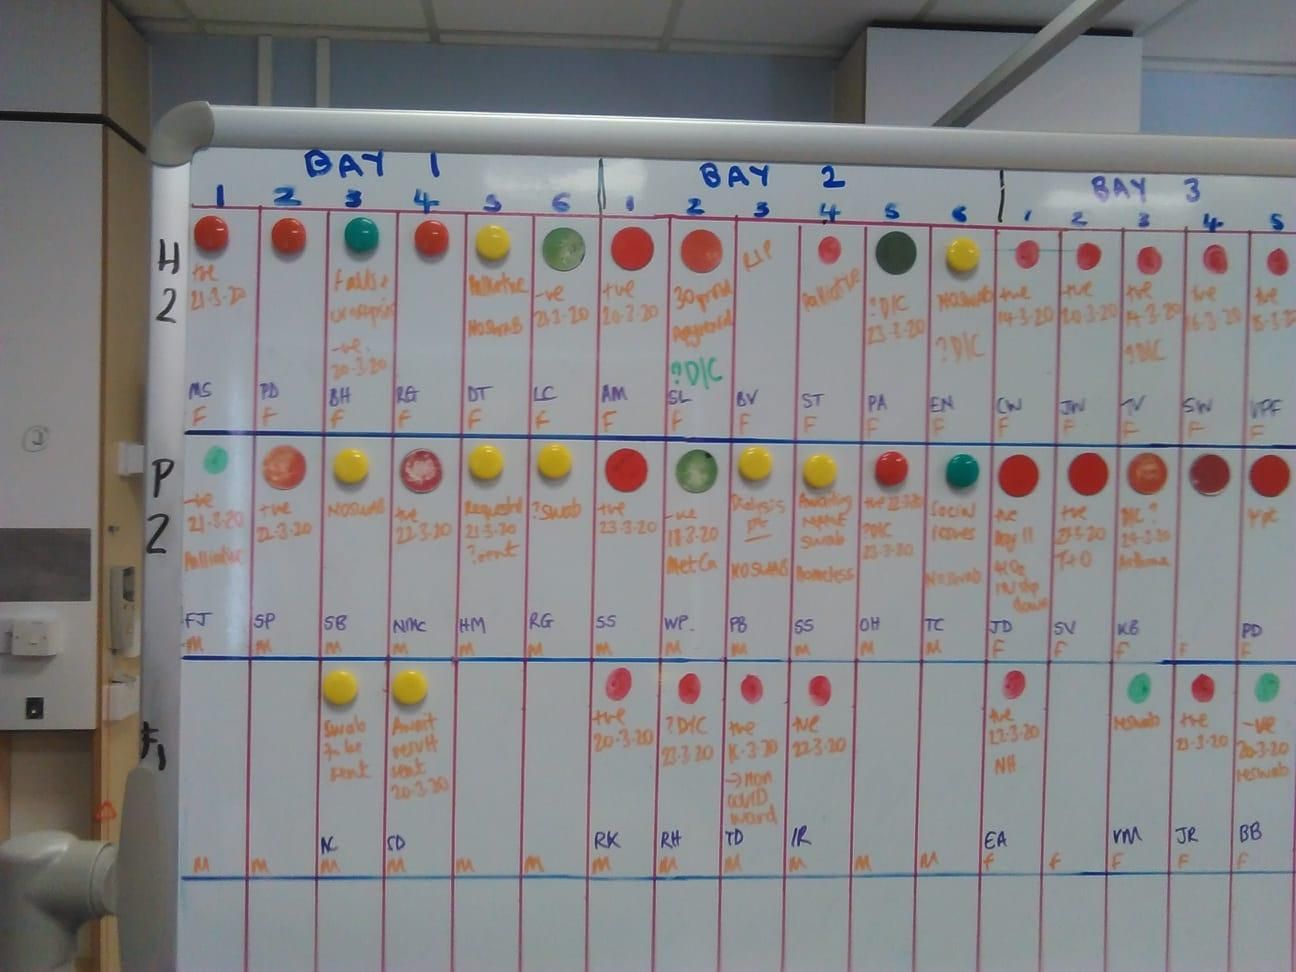
Diagram 2: Excel database / electronic copy of the “Rosh board”
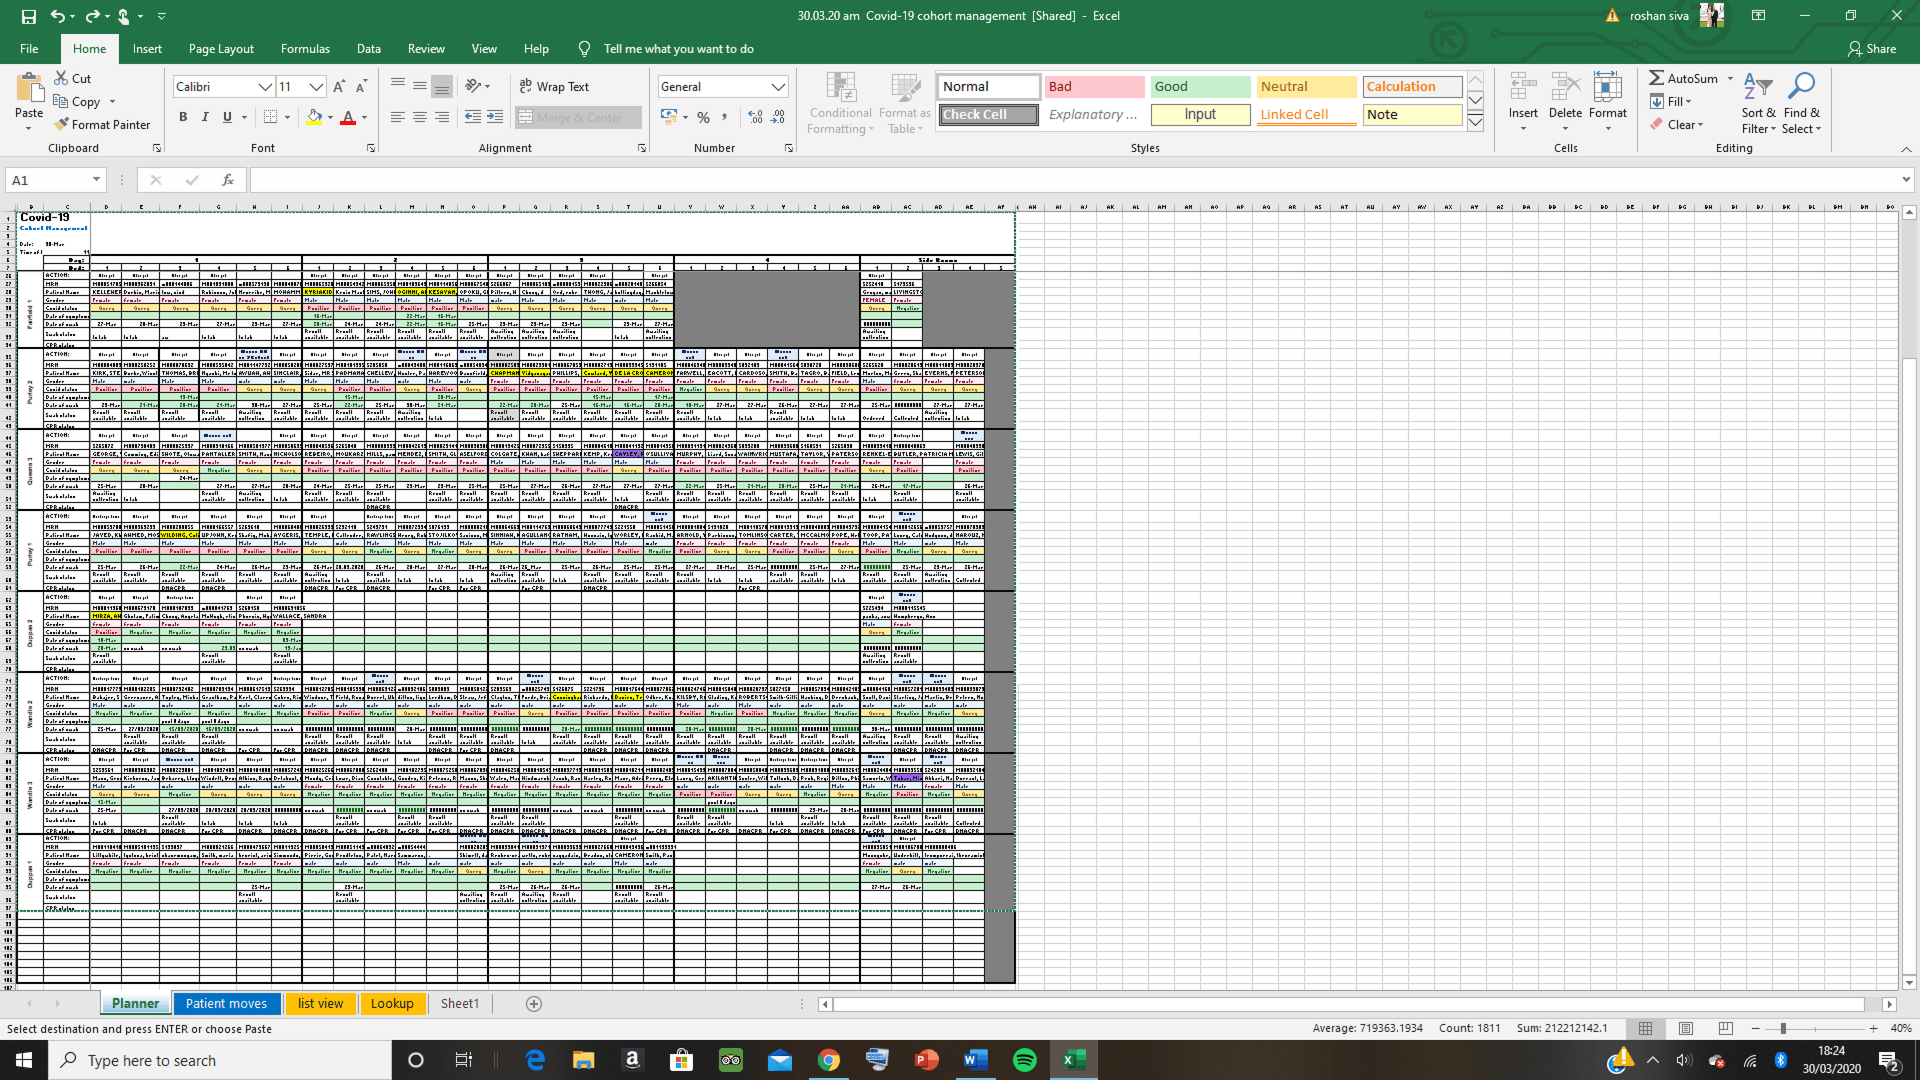
Diagram 3: PATIENTEER showing ward dashboard
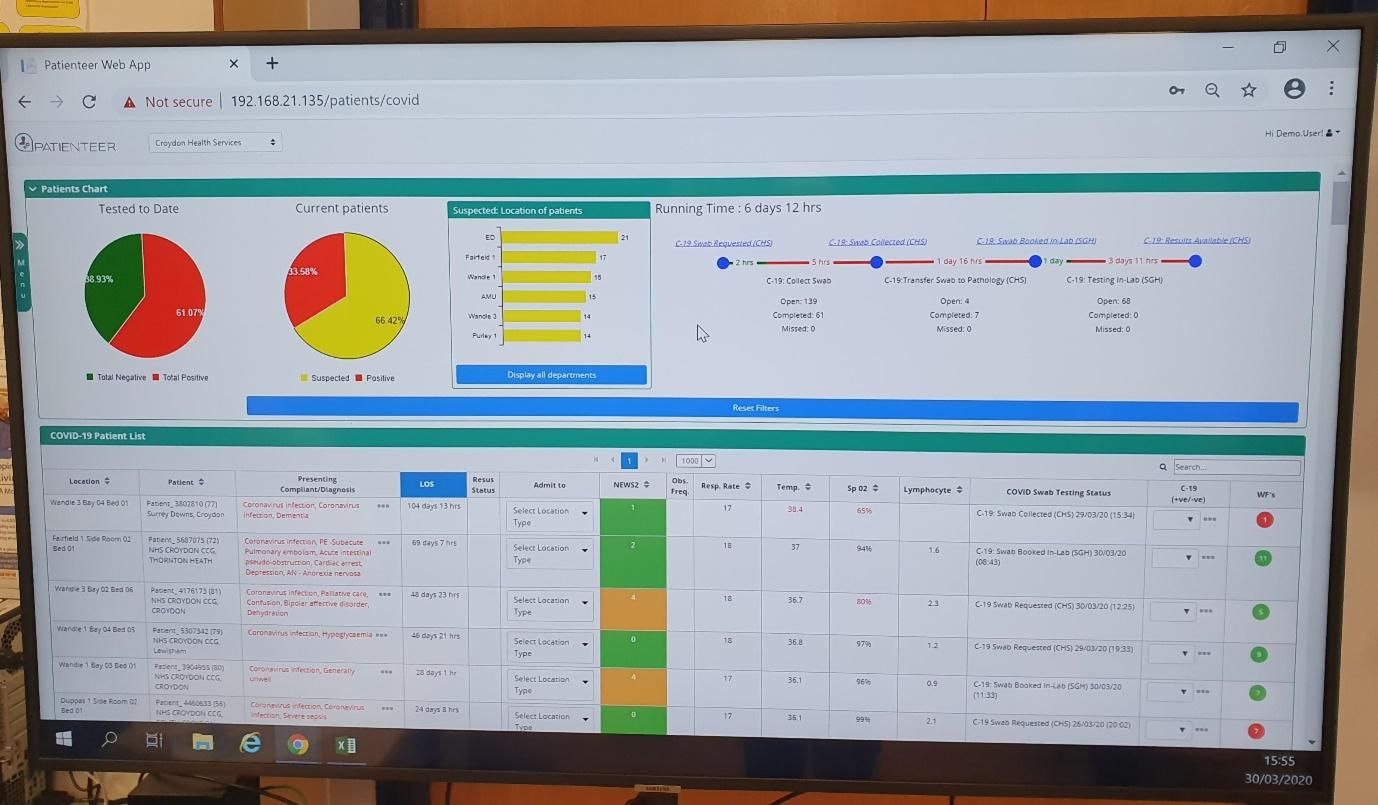
Diagram 4: PATIENTEER showing exact stage in processing of a swab result (sample collected but still not reached local lab at Croydon after 2 days!)
“Rosh board” and PATIENTEER working together are significantly improving our ability to manage the treatment of patients with COVID disease in Croydon.
